

By Institution
The map and source data below contain information regarding FY 2025 user projects at the Office of Science User Facilities, summarized at the institutional level. For example, one may explore the data to reveal the number of users from a particular institution that used a particular user facility. The data can be grouped and filtered to narrow the displayed results. See the interactive map usage tips below for more information.
Full screen view:
View the map in a separate browser window, scalable to full screen.
Source data:
Group, filter, and search the map data:
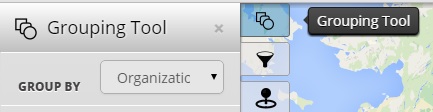
To group the displayed data, select the Grouping Tool and attribute:
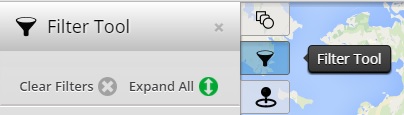
To filter the displayed data, select the Filter Tool:
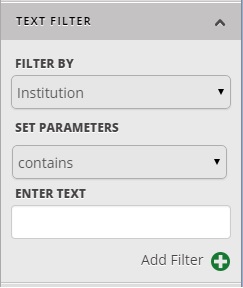
To filter the displayed data through a text search, select the “Text Filter” under the Filter Tool:
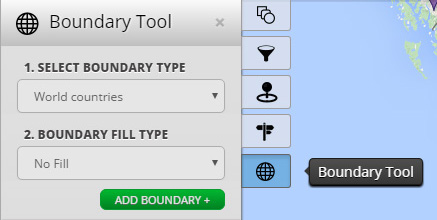
The Boundary Tool can provide summary data by specific geographies including country, U.S. states, counties, zip codes and congressional districts. To overlay geographic boundaries, select the Boundary Tool and the “boundary type.” You have the option to shade the regions with a scale tied to numerical data, such as the number of users:
Program abbreviation key:
- ASCR = Advanced Scientific Computing Research
- BER = Biological and Environmental Research
- BES = Basic Energy Sciences
- FES = Fusion Energy Sciences
- HEP = High Energy Physics
- NP = Nuclear Physics